Data bases
Introduction
Chapter requirements
We use R package agrodata. See these
installation instructions.
Sacks data
There are data for 20 crops, some are divided into two groups (winter / spring) or (main / 2nd season).
library(agrodata)
agrodata::crop_calendar_sacks()
## Choose one of:
##  [1] "Barley (winter)"       "Barley (spring)"       "Cassava"
##  [4] "Cotton"                "Groundnut"             "Maize (main season)"
##  [7] "Maize (2nd season)"    "Millet"                "Oat (winter)"
## [10] "Oat (spring)"          "Potato"                "Pulses"
## [13] "Rapeseed"              "Rice (main season)"    "Rice (2nd season)"
## [16] "Rye"                   "Sorghum (main season)" "Sorghum (2nd season)"
## [19] "soybean"               "sugarbeet"             "Sunflower"
## [22] "Sweetpotato"           "Wheat (winter)"        "Wheat (spring)"
## [25] "Yam"
We choose “Maize (main season)”
r <- agrodata::crop_calendar_sacks("Maize (main season)")
r
## class       : SpatRaster
## dimensions  : 2160, 4320, 13  (nrow, ncol, nlyr)
## resolution  : 0.08333333, 0.08333334  (x, y)
## extent      : -180, 180, -90, 90  (xmin, xmax, ymin, ymax)
## coord. ref. :
## data sources: NETCDF:"./Maize.crop.calendar.nc":harvest
##               NETCDF:"./Maize.crop.calendar.nc":harvest.end
##               NETCDF:"./Maize.crop.calendar.nc":harvest.range
##               NETCDF:"./Maize.crop.calendar.nc":harvest.start
##               NETCDF:"./Maize.crop.calendar.nc":harvested.area
##               ... and 8 more sources
## names       : harvest, harvest.end, harvest.range, harvest.start, harvested.area, ...
Note that there are 13 variables in this dataset for each crop.
names(r)
##  [1] "harvest"                 "harvest.end"
##  [3] "harvest.range"           "harvest.start"
##  [5] "harvested.area"          "harvested.area.fraction"
##  [7] "index"                   "plant"
##  [9] "plant.end"               "plant.range"
## [11] "plant.start"             "political.level"
## [13] "tot.days"
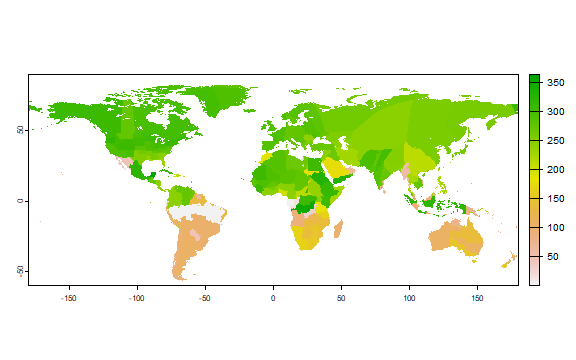
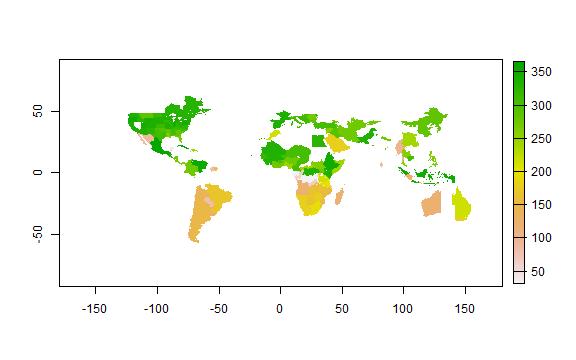
The mean day of harvest
plot(r[["harvest"]])
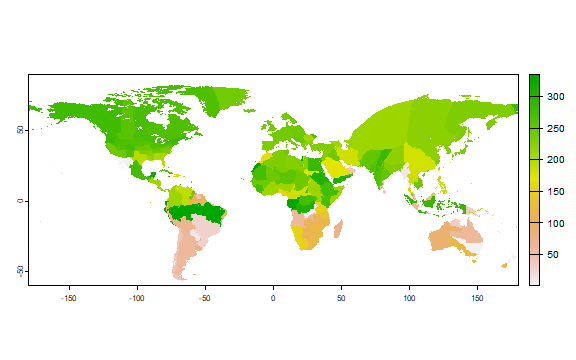
But harvesting is not all done on one day. It is estimated to start on this day:
plot(r["harvest.start"])
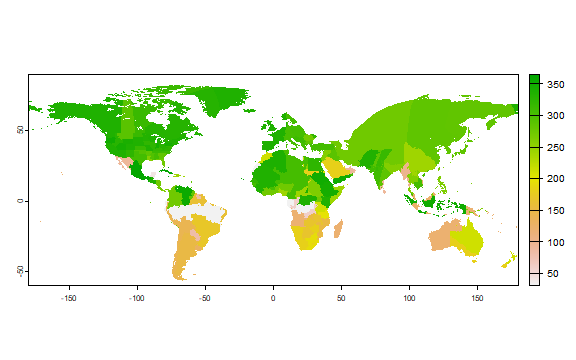
 And end on
plot(r["harvest.end"])
“harvest.range” is the difference between “harvest.start” and “harvest.end”
The “harvest.*” variables are also avaiable for planting.
plot(r["harvest.end"])
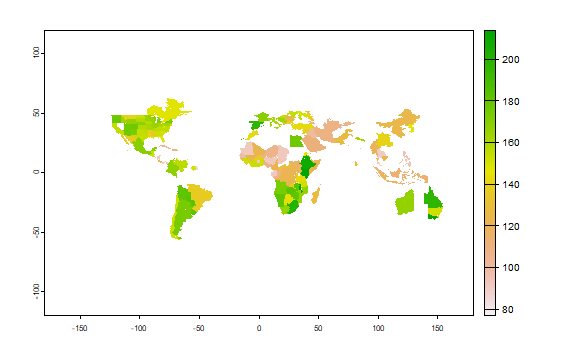
“tot.days” is the number of days between planting and harvest.
plot(r["tot.days"])
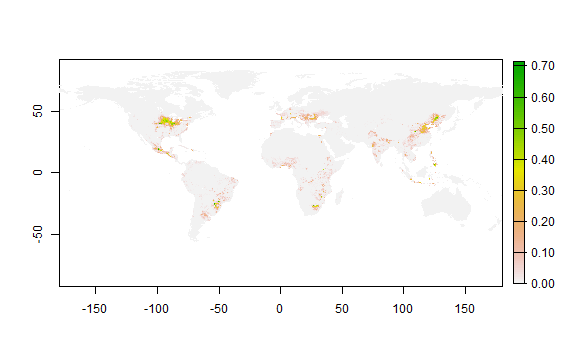
“harvested.area” has the crop area in ha, and “harvested.area.fraction” has it as a fraction of the grid cell.
plot(r["harvested.area.fraction"])