Weather data
Introduction
Like other crop models, WOFOST requires daily weather data to simulate crop growth. And in many cases you will want to have data for many, perhaps 30, years for each location, so that you can look at variabillity. Obtaining daily weather data of sufficient quality, for a sufficient time lenght (let’s say 30 years) and at a sufficient spatial density used to be an enourmous challange for almost every region of the world.
There is much more daily weather data available now then ever before — even though the quality of differnt data products is difficult to assess. See the data section and the spatial WOFOST chapter for more discussion.
Example
Here we use an example file that comes with the R package meteor.
Rwofost depends on meteor so you should have it on your computer
if you have Rwofost.
library(Rwofost)
## Warning: package 'Rwofost' was built under R version 4.3.1
f <- system.file("extdata/Philippines_IRRI.csv", package="meteor")
basename(f)
## [1] "Philippines_IRRI.csv"
Note that the system.file bit is only used to find the meteor
package on your computer. Do not use it with your own files.
Now that we have a filename, and we see it is “csv” (comma separated values) format, we can read it.
w <- read.csv(f)
head(w)
##         date  srad tmin tmax vapr wind prec
## 1 1979-01-01 10656 22.1 28.0 2.64  1.4  1.3
## 2 1979-01-02  7740 21.5 27.0 2.43  1.4  0.0
## 3 1979-01-03 11700 23.0 28.5 2.66  0.9  0.0
## 4 1979-01-04 14004 21.5 28.5 2.53  0.8  0.0
## 5 1979-01-05 17316 18.5 29.0 2.18  0.7  0.0
## 6 1979-01-06 16092 18.7 29.0 2.40  0.6  0.0
You can use any source of weather data you want (and deem reliable), but
you have to create a data.frame with the following column names:
date ,srad ,tmin ,tmax ,vapr ,wind ,prec. All variables should be
numeric (or integer), except date which should contain Dates.
Let’s find out what data types we have.
sapply(w, class)
##        date        srad        tmin        tmax        vapr        wind
## "character"   "integer"   "numeric"   "numeric"   "numeric"   "numeric"
##        prec
##   "numeric"
And change the “date” column from “character” to “Date”
w$date <- as.Date(w$date)
It is also very important to assure that the weather variables have the correct units. These are the units that Rwofost uses.
variable |
description |
unit |
|---|---|---|
date |
‘Date’ |
– |
srad |
Solar radiation |
kJ m-2 day-1 |
tmin |
Minimum temperature |
°C |
tmax |
Maximum temperature |
°C |
vapr |
Vapor pressure |
kPa |
wind |
Wind speed |
m s-1 |
prec |
Precipitation |
mm day-1 |
Let’s find a little bit more about what we have.
nrow(w)
## [1] 4717
head(w)
##         date  srad tmin tmax vapr wind prec
## 1 1979-01-01 10656 22.1 28.0 2.64  1.4  1.3
## 2 1979-01-02  7740 21.5 27.0 2.43  1.4  0.0
## 3 1979-01-03 11700 23.0 28.5 2.66  0.9  0.0
## 4 1979-01-04 14004 21.5 28.5 2.53  0.8  0.0
## 5 1979-01-05 17316 18.5 29.0 2.18  0.7  0.0
## 6 1979-01-06 16092 18.7 29.0 2.40  0.6  0.0
tail(w)
##            date  srad tmin tmax vapr wind prec
## 4712 1991-12-26 11900 23.2 28.4 2.73  1.8  0.2
## 4713 1991-12-27 12300 21.3 28.7 2.63  1.2  0.1
## 4714 1991-12-28 17700 21.1 32.0 2.70  1.2  0.4
## 4715 1991-12-29  8600 23.2 27.0 2.63  1.3  2.8
## 4716 1991-12-30 15500 22.4 28.1 2.56  2.9  0.0
## 4717 1991-12-31 16300 23.0 28.7 2.49  2.2  0.0
We have 4717 records, starting on 1979-01-01 and ending on 1991-12-31.
Note that the weather data has to be consecutive — the model does not check that, and will assume that 4 April follows 3 July if you present the data that way. We can check if this is the case.
First, does the number of rows match the date range?
w[nrow(w), "date"] - w[1, "date"]
## Time difference of 4747 days
nrow(w)
## [1] 4717
Are all the dates consecutive?
d <- diff(w$date)
all(d == 1)
## [1] FALSE
Uy, they are not! Let’s see what is going on.
table(d)
## d
##    1   32
## 4715    1
i <- which(d > 1)
w[i:(i+1), ]
##            date  srad tmin tmax vapr wind prec
## 3987 1989-11-30 11340 22.1 26.7 2.23  3.1    0
## 3988 1990-01-01    18 18.5 29.5 2.41  1.1    0
December 1989 is missing! Good to know…
Conversion
If you have different weather data, or in other units, you may need to convert it.
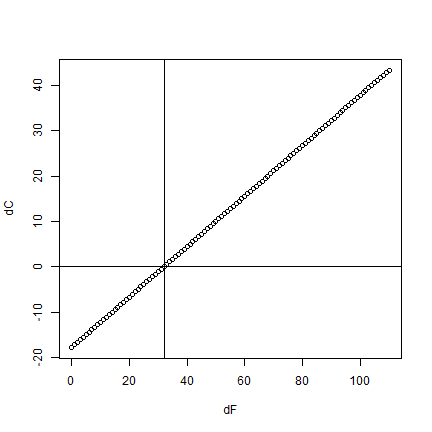
To go from °F (Fahrenheit) to °C (Celsius; or, as Americans say, Centigrade) you can do
degC <- function(F) 5 * (F - 32) / 9
dF <- 0:110
dC <- degC(dF)
plot(dF, dC)
abline(h=0)
abline(v=32)
If you do not have vapor pressure you can compute it from another measure of air humidity, such as relative humidity or dew-point temperature. See the meteor package.
Weather simulation
to be done