Soil compaction effect on rice
1. Background and introduction
This case study shows how to do principal component analysis and stepwise multiple regression in R.
Here we follow the analysis of the study by Singh et al (2017), entitled “Depth of soil compaction predominantly affects rice yield reduction by reproductive-stage drought at varietal screening sites in Bangladesh, India, and Nepal”. The study was published in the journal Plant Soil. You can access the article (it is behind a paywall) online. The data was also made available on Harvard Dataverse and can be downloaded.
— Things to be noted here: Variables released in the dataset are not the same as in the paper. Results in the case study are different from the paper.—
2. Get the data
library(agro)
ff <- get_data_from_uri("https://doi.org/10.7910/DVN/SNQZTT", ".")
ff
## [1] "./doi_10.7910_DVN_SNQZTT/all data for PCA w imputed.xlsx"
## [2] "./doi_10.7910_DVN_SNQZTT/penetrometer.csv"
## [3] "./doi_10.7910_DVN_SNQZTT/rainfall tensiom water table.csv"
## [4] "./doi_10.7910_DVN_SNQZTT/soil texture.csv"
## [5] "./doi_10.7910_DVN_SNQZTT/Variable Descriptions.txt"
2.1. Import data
The data is provided as a tab file. This file can be read by read.table function in R.
library(readxl)
# Import table of data
wdata <- read_excel(ff[1])
# Check column names to see the variable provided
colnames(wdata)
##  [1] "Year"                        "location"
##  [3] "Ave yield control"           "Ave yield stress"
##  [5] "% yield reduction"           "Rainfall 60-100 DAS"
##  [7] "ave tensiom 60-100"          "max tensiom 60-100"
##  [9] "aver water table 60-100 DAS" "bd 5-10 cm"
## [11] "bd 25-30 cm"                 "pH"
## [13] "Avail-P ppm"                 "Exch-K ppm"
## [15] "% Clay"                      "% Silt"
## [17] "% Sand"                      "0.1 bar 5-10 cm"
## [19] "3 bar 5-10 cm"               "5 bar 5-10 cm"
## [21] "15 bar 5-10 cm"              "max penetrom"
## [23] "depth of max penetrom"       "penetrom 30 cm"
2.2. Subset data
Subset data for use and delete the information not use in the following analysis
wdata1 <- wdata[, !(colnames(wdata) %in% c("Year", "location", "Ave yield control", "Ave yield stress"))]
3. Explore data
3.1. Step-wise multiple regression for table 5 in the paper
Yield reduction by drought across three years of study as a function of rainfall and soil-related parameters as determined by step-wise multiple regression
3.1.1 First, use regsubsets(), which is a function in r for model selection
# Make a multiple linear regression model with all explanatory variables and yield reduction as the response variable
# Load packages
library(car)
## Loading required package: carData
# Using the dot notation for shorter code, which means everything else in the data frame
model_full <- lm(`% yield reduction` ~ ., wdata1)
# Start with all variables and develop a good model using regsubsets() from the leaps package. Select the model with the minimum BIC
# Load packages
library(leaps)
## Warning: package 'leaps' was built under R version 4.3.1
# Using regsubset
model_regsub <- regsubsets(`% yield reduction` ~ ., data = wdata1)
## Warning in leaps.setup(x, y, wt = wt, nbest = nbest, nvmax = nvmax, force.in =
## force.in, : 9 linear dependencies found
# View results
summary(model_regsub)
## Subset selection object
## Call: eval(expr, envir, enclos)
## 19 Variables  (and intercept)
##                               Forced in Forced out
## `Rainfall 60-100 DAS`             FALSE      FALSE
## `ave tensiom 60-100`              FALSE      FALSE
## `max tensiom 60-100`              FALSE      FALSE
## `aver water table 60-100 DAS`     FALSE      FALSE
## `bd 5-10 cm`                      FALSE      FALSE
## `bd 25-30 cm`                     FALSE      FALSE
## pH                                FALSE      FALSE
## `Avail-P ppm`                     FALSE      FALSE
## `Exch-K ppm`                      FALSE      FALSE
## `% Clay`                          FALSE      FALSE
## `% Silt`                          FALSE      FALSE
## `% Sand`                          FALSE      FALSE
## `0.1 bar 5-10 cm`                 FALSE      FALSE
## `3 bar 5-10 cm`                   FALSE      FALSE
## `5 bar 5-10 cm`                   FALSE      FALSE
## `15 bar 5-10 cm`                  FALSE      FALSE
## `max penetrom`                    FALSE      FALSE
## `depth of max penetrom`           FALSE      FALSE
## `penetrom 30 cm`                  FALSE      FALSE
## 1 subsets of each size up to 8
## Selection Algorithm: exhaustive
##          `Rainfall 60-100 DAS` `ave tensiom 60-100` `max tensiom 60-100`
## 1  ( 1 ) " "                   " "                  "*"
## 2  ( 1 ) " "                   " "                  "*"
## 3  ( 1 ) "*"                   " "                  "*"
## 4  ( 1 ) "*"                   " "                  "*"
## 5  ( 1 ) " "                   " "                  " "
## 6  ( 1 ) "*"                   " "                  " "
## 7  ( 1 ) "*"                   "*"                  " "
## 8  ( 1 ) "*"                   "*"                  "*"
##          `aver water table 60-100 DAS` `bd 5-10 cm` `bd 25-30 cm` pH
## 1  ( 1 ) " "                           " "          " "           " "
## 2  ( 1 ) " "                           " "          " "           "*"
## 3  ( 1 ) " "                           " "          " "           "*"
## 4  ( 1 ) " "                           " "          " "           " "
## 5  ( 1 ) "*"                           " "          " "           " "
## 6  ( 1 ) "*"                           "*"          "*"           "*"
## 7  ( 1 ) "*"                           "*"          " "           "*"
## 8  ( 1 ) "*"                           "*"          " "           "*"
##          `Avail-P ppm` `Exch-K ppm` `% Clay` `% Silt` `% Sand`
## 1  ( 1 ) " "           " "          " "      " "      " "
## 2  ( 1 ) " "           " "          " "      " "      " "
## 3  ( 1 ) " "           " "          " "      " "      " "
## 4  ( 1 ) " "           " "          " "      " "      " "
## 5  ( 1 ) " "           "*"          " "      "*"      " "
## 6  ( 1 ) " "           " "          " "      " "      " "
## 7  ( 1 ) " "           " "          "*"      " "      " "
## 8  ( 1 ) " "           " "          "*"      " "      " "
##          `0.1 bar 5-10 cm` `3 bar 5-10 cm` `5 bar 5-10 cm` `15 bar 5-10 cm`
## 1  ( 1 ) " "               " "             " "             " "
## 2  ( 1 ) " "               " "             " "             " "
## 3  ( 1 ) " "               " "             " "             " "
## 4  ( 1 ) " "               " "             " "             "*"
## 5  ( 1 ) " "               " "             " "             "*"
## 6  ( 1 ) " "               " "             " "             " "
## 7  ( 1 ) " "               " "             " "             " "
## 8  ( 1 ) " "               " "             " "             " "
##          `max penetrom` `depth of max penetrom` `penetrom 30 cm`
## 1  ( 1 ) " "            " "                     " "
## 2  ( 1 ) " "            " "                     " "
## 3  ( 1 ) " "            " "                     " "
## 4  ( 1 ) " "            " "                     "*"
## 5  ( 1 ) "*"            " "                     " "
## 6  ( 1 ) " "            "*"                     " "
## 7  ( 1 ) " "            "*"                     " "
## 8  ( 1 ) " "            "*"                     " "
# Visually determine best model by BIC (subset( ) are bic, cp, adjr2, and rss.)
summary(model_regsub)$bic
## [1] -24.36176 -29.64764 -31.70518 -34.89176 -40.10164 -44.31511 -47.67645
## [8] -62.07997
subsets(model_regsub, statistic = "bic", legend = F)
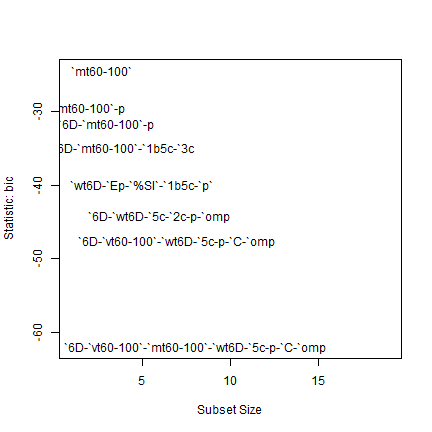
##                               Abbreviation
## `Rainfall 60-100 DAS`                  `6D
## `ave tensiom 60-100`            `vt60-100`
## `max tensiom 60-100`            `mt60-100`
## `aver water table 60-100 DAS`        `wt6D
## `bd 5-10 cm`                           `5c
## `bd 25-30 cm`                          `2c
## pH                                       p
## `Avail-P ppm`                          `Ap
## `Exch-K ppm`                           `Ep
## `% Clay`                                `C
## `% Silt`                             `%Sl`
## `% Sand`                             `%Sn`
## `0.1 bar 5-10 cm`                    `0b5c
## `3 bar 5-10 cm`                      `3b5c
## `5 bar 5-10 cm`                      `5b5c
## `15 bar 5-10 cm`                     `1b5c
## `max penetrom`                         `p`
## `depth of max penetrom`               `omp
## `penetrom 30 cm`                       `3c
# Creat the best model
model_reduced <- lm(`% yield reduction` ~ `Rainfall 60-100 DAS` + `ave tensiom 60-100` + `max tensiom 60-100` + `aver water table 60-100 DAS` + `bd 5-10 cm` + pH + `% Clay` + `depth of max penetrom`, data = wdata1)
summary(model_reduced)
##
## Call:
## lm(formula = `% yield reduction` ~ `Rainfall 60-100 DAS` + `ave tensiom 60-100` +
##     `max tensiom 60-100` + `aver water table 60-100 DAS` + `bd 5-10 cm` +
##     pH + `% Clay` + `depth of max penetrom`, data = wdata1)
##
## Residuals:
##        1        2        9       11       16       24       26       31
## -0.57505  0.37881 -0.27115  0.67720  0.54332  1.42357  0.08142  0.22219
##       33       36       38       40
## -0.55984 -0.33308 -1.24719 -0.34020
##
## Coefficients:
##                                 Estimate Std. Error t value Pr(>|t|)
## (Intercept)                    8.901e+02  1.005e+02   8.858  0.00303 **
## `Rainfall 60-100 DAS`         -4.606e-02  7.291e-03  -6.318  0.00802 **
## `ave tensiom 60-100`           1.518e+00  2.724e-01   5.572  0.01141 *
## `max tensiom 60-100`          -6.051e-01  1.989e-01  -3.042  0.05577 .
## `aver water table 60-100 DAS` -9.579e-01  1.218e-01  -7.861  0.00429 **
## `bd 5-10 cm`                  -3.486e+02  4.253e+01  -8.197  0.00380 **
## pH                            -2.171e+01  1.982e+00 -10.951  0.00163 **
## `% Clay`                      -5.970e-01  8.378e-02  -7.125  0.00569 **
## `depth of max penetrom`       -5.618e-01  5.863e-02  -9.582  0.00241 **
## ---
## Signif. codes:  0 '***' 0.001 '**' 0.01 '*' 0.05 '.' 0.1 ' ' 1
##
## Residual standard error: 1.351 on 3 degrees of freedom
##   (28 observations deleted due to missingness)
## Multiple R-squared:  0.9991, Adjusted R-squared:  0.9968
## F-statistic: 426.4 on 8 and 3 DF,  p-value: 0.0001707
# Compare the best model with the full model
anova(model_full, model_reduced)
## Analysis of Variance Table
##
## Model 1: `% yield reduction` ~ `Rainfall 60-100 DAS` + `ave tensiom 60-100` +
##     `max tensiom 60-100` + `aver water table 60-100 DAS` + `bd 5-10 cm` +
##     `bd 25-30 cm` + pH + `Avail-P ppm` + `Exch-K ppm` + `% Clay` +
##     `% Silt` + `% Sand` + `0.1 bar 5-10 cm` + `3 bar 5-10 cm` +
##     `5 bar 5-10 cm` + `15 bar 5-10 cm` + `max penetrom` + `depth of max penetrom` +
##     `penetrom 30 cm`
## Model 2: `% yield reduction` ~ `Rainfall 60-100 DAS` + `ave tensiom 60-100` +
##     `max tensiom 60-100` + `aver water table 60-100 DAS` + `bd 5-10 cm` +
##     pH + `% Clay` + `depth of max penetrom`
##   Res.Df    RSS Df Sum of Sq      F  Pr(>F)
## 1      1 0.0243
## 2      3 5.4796 -2   -5.4553 112.03 0.06666 .
## ---
## Signif. codes:  0 '***' 0.001 '**' 0.01 '*' 0.05 '.' 0.1 ' ' 1
3.1.2. Second, use stepAIC() function from MASS package perform step model selection by AIC including forward, backward and both
library(MASS)
# Stepwise Regression
model_step <- stepAIC(model_full, direction = "both")
## Start:  AIC=-52.4
## `% yield reduction` ~ `Rainfall 60-100 DAS` + `ave tensiom 60-100` +
##     `max tensiom 60-100` + `aver water table 60-100 DAS` + `bd 5-10 cm` +
##     `bd 25-30 cm` + pH + `Avail-P ppm` + `Exch-K ppm` + `% Clay` +
##     `% Silt` + `% Sand` + `0.1 bar 5-10 cm` + `3 bar 5-10 cm` +
##     `5 bar 5-10 cm` + `15 bar 5-10 cm` + `max penetrom` + `depth of max penetrom` +
##     `penetrom 30 cm`
##
##
## Step:  AIC=-52.4
## `% yield reduction` ~ `Rainfall 60-100 DAS` + `ave tensiom 60-100` +
##     `max tensiom 60-100` + `aver water table 60-100 DAS` + `bd 5-10 cm` +
##     `bd 25-30 cm` + pH + `Avail-P ppm` + `Exch-K ppm` + `% Clay` +
##     `% Silt` + `% Sand` + `0.1 bar 5-10 cm` + `3 bar 5-10 cm` +
##     `5 bar 5-10 cm` + `15 bar 5-10 cm` + `max penetrom` + `depth of max penetrom`
##
##
## Step:  AIC=-52.4
## `% yield reduction` ~ `Rainfall 60-100 DAS` + `ave tensiom 60-100` +
##     `max tensiom 60-100` + `aver water table 60-100 DAS` + `bd 5-10 cm` +
##     `bd 25-30 cm` + pH + `Avail-P ppm` + `Exch-K ppm` + `% Clay` +
##     `% Silt` + `% Sand` + `0.1 bar 5-10 cm` + `3 bar 5-10 cm` +
##     `5 bar 5-10 cm` + `15 bar 5-10 cm` + `max penetrom`
##
##
## Step:  AIC=-52.4
## `% yield reduction` ~ `Rainfall 60-100 DAS` + `ave tensiom 60-100` +
##     `max tensiom 60-100` + `aver water table 60-100 DAS` + `bd 5-10 cm` +
##     `bd 25-30 cm` + pH + `Avail-P ppm` + `Exch-K ppm` + `% Clay` +
##     `% Silt` + `% Sand` + `0.1 bar 5-10 cm` + `3 bar 5-10 cm` +
##     `5 bar 5-10 cm` + `15 bar 5-10 cm`
##
##
## Step:  AIC=-52.4
## `% yield reduction` ~ `Rainfall 60-100 DAS` + `ave tensiom 60-100` +
##     `max tensiom 60-100` + `aver water table 60-100 DAS` + `bd 5-10 cm` +
##     `bd 25-30 cm` + pH + `Avail-P ppm` + `Exch-K ppm` + `% Clay` +
##     `% Silt` + `% Sand` + `0.1 bar 5-10 cm` + `3 bar 5-10 cm` +
##     `5 bar 5-10 cm`
##
##
## Step:  AIC=-52.4
## `% yield reduction` ~ `Rainfall 60-100 DAS` + `ave tensiom 60-100` +
##     `max tensiom 60-100` + `aver water table 60-100 DAS` + `bd 5-10 cm` +
##     `bd 25-30 cm` + pH + `Avail-P ppm` + `Exch-K ppm` + `% Clay` +
##     `% Silt` + `% Sand` + `0.1 bar 5-10 cm` + `3 bar 5-10 cm`
##
##
## Step:  AIC=-52.4
## `% yield reduction` ~ `Rainfall 60-100 DAS` + `ave tensiom 60-100` +
##     `max tensiom 60-100` + `aver water table 60-100 DAS` + `bd 5-10 cm` +
##     `bd 25-30 cm` + pH + `Avail-P ppm` + `Exch-K ppm` + `% Clay` +
##     `% Silt` + `% Sand` + `0.1 bar 5-10 cm`
##
##
## Step:  AIC=-52.4
## `% yield reduction` ~ `Rainfall 60-100 DAS` + `ave tensiom 60-100` +
##     `max tensiom 60-100` + `aver water table 60-100 DAS` + `bd 5-10 cm` +
##     `bd 25-30 cm` + pH + `Avail-P ppm` + `Exch-K ppm` + `% Clay` +
##     `% Silt` + `% Sand`
##
##
## Step:  AIC=-52.4
## `% yield reduction` ~ `Rainfall 60-100 DAS` + `ave tensiom 60-100` +
##     `max tensiom 60-100` + `aver water table 60-100 DAS` + `bd 5-10 cm` +
##     `bd 25-30 cm` + pH + `Avail-P ppm` + `Exch-K ppm` + `% Clay` +
##     `% Silt`
##
##
## Step:  AIC=-52.4
## `% yield reduction` ~ `Rainfall 60-100 DAS` + `ave tensiom 60-100` +
##     `max tensiom 60-100` + `aver water table 60-100 DAS` + `bd 5-10 cm` +
##     `bd 25-30 cm` + pH + `Avail-P ppm` + `Exch-K ppm` + `% Clay`
##
##                                 Df Sum of Sq     RSS     AIC
## <none>                                         0.024 -52.402
## - `bd 25-30 cm`                  1     2.541   2.566   1.488
## - `Rainfall 60-100 DAS`          1     8.517   8.542  15.920
## - `max tensiom 60-100`           1    20.159  20.183  26.239
## - `ave tensiom 60-100`           1    36.034  36.058  33.203
## - `Avail-P ppm`                  1    36.725  36.750  33.431
## - `aver water table 60-100 DAS`  1    62.781  62.806  39.862
## - `bd 5-10 cm`                   1   123.621 123.646  47.990
## - `% Clay`                       1   125.970 125.995  48.216
## - pH                             1   136.495 136.520  49.179
## - `Exch-K ppm`                   1   147.668 147.693  50.123
# Display results
model_step$anova
## Stepwise Model Path
## Analysis of Deviance Table
##
## Initial Model:
## `% yield reduction` ~ `Rainfall 60-100 DAS` + `ave tensiom 60-100` +
##     `max tensiom 60-100` + `aver water table 60-100 DAS` + `bd 5-10 cm` +
##     `bd 25-30 cm` + pH + `Avail-P ppm` + `Exch-K ppm` + `% Clay` +
##     `% Silt` + `% Sand` + `0.1 bar 5-10 cm` + `3 bar 5-10 cm` +
##     `5 bar 5-10 cm` + `15 bar 5-10 cm` + `max penetrom` + `depth of max penetrom` +
##     `penetrom 30 cm`
##
## Final Model:
## `% yield reduction` ~ `Rainfall 60-100 DAS` + `ave tensiom 60-100` +
##     `max tensiom 60-100` + `aver water table 60-100 DAS` + `bd 5-10 cm` +
##     `bd 25-30 cm` + pH + `Avail-P ppm` + `Exch-K ppm` + `% Clay`
##
##
##                         Step Df Deviance Resid. Df Resid. Dev       AIC
## 1                                                1 0.02434837 -52.40236
## 2         - `penetrom 30 cm`  0        0         1 0.02434837 -52.40236
## 3  - `depth of max penetrom`  0        0         1 0.02434837 -52.40236
## 4           - `max penetrom`  0        0         1 0.02434837 -52.40236
## 5         - `15 bar 5-10 cm`  0        0         1 0.02434837 -52.40236
## 6          - `5 bar 5-10 cm`  0        0         1 0.02434837 -52.40236
## 7          - `3 bar 5-10 cm`  0        0         1 0.02434837 -52.40236
## 8        - `0.1 bar 5-10 cm`  0        0         1 0.02434837 -52.40236
## 9                 - `% Sand`  0        0         1 0.02434837 -52.40236
## 10                - `% Silt`  0        0         1 0.02434837 -52.40236
# Final model
model_final <- lm(`% yield reduction` ~ `Rainfall 60-100 DAS` + `ave tensiom 60-100` + `max tensiom 60-100` + `aver water table 60-100 DAS` + `bd 5-10 cm` + `bd 25-30 cm` + pH + `Avail-P ppm` + `Exch-K ppm` + `% Clay`, data = wdata1)
# Compare models (best reduced model from the previous analysis vs. the final model from this analysis)
anova(model_reduced, model_final)
## Analysis of Variance Table
##
## Model 1: `% yield reduction` ~ `Rainfall 60-100 DAS` + `ave tensiom 60-100` +
##     `max tensiom 60-100` + `aver water table 60-100 DAS` + `bd 5-10 cm` +
##     pH + `% Clay` + `depth of max penetrom`
## Model 2: `% yield reduction` ~ `Rainfall 60-100 DAS` + `ave tensiom 60-100` +
##     `max tensiom 60-100` + `aver water table 60-100 DAS` + `bd 5-10 cm` +
##     `bd 25-30 cm` + pH + `Avail-P ppm` + `Exch-K ppm` + `% Clay`
##   Res.Df    RSS Df Sum of Sq      F  Pr(>F)
## 1      3 5.4796
## 2      1 0.0243  2    5.4553 112.03 0.06666 .
## ---
## Signif. codes:  0 '***' 0.001 '**' 0.01 '*' 0.05 '.' 0.1 ' ' 1
3.2. Principal component analysis for table 6
Eigenvector values from a principal component analysis of yield reduction by drought a various soil characteristics at the research station drought screening sites characterized in this study.
# Perform  a PCA on the 20 varaibles using the correlation matrix
# Load package
library(stats)
# Pricipal Component Analysis (When scale=TRUE, the correlation matrix is used, omit data wich is NA)
sr.pca <- prcomp(na.omit(wdata1), scale = TRUE)
# Display results
summary(sr.pca)
## Importance of components:
##                           PC1    PC2    PC3    PC4     PC5     PC6     PC7
## Standard deviation     2.6393 2.1736 1.8476 1.4634 1.11394 1.05625 0.56808
## Proportion of Variance 0.3483 0.2362 0.1707 0.1071 0.06204 0.05578 0.01614
## Cumulative Proportion  0.3483 0.5845 0.7552 0.8623 0.92433 0.98011 0.99625
##                            PC8     PC9    PC10      PC11      PC12
## Standard deviation     0.18562 0.17563 0.09851 0.0009984 1.112e-15
## Proportion of Variance 0.00172 0.00154 0.00049 0.0000000 0.000e+00
## Cumulative Proportion  0.99797 0.99951 1.00000 1.0000000 1.000e+00
# Using a scree plot to check how many PC's to retain (find elbow)
plot(sr.pca, type = "l", main ="PCA of dataset")
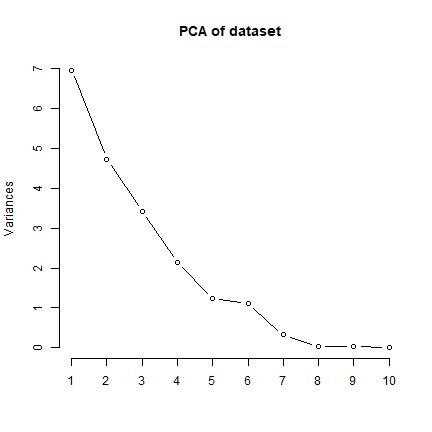
# Check eigenvalues for each PC
summary(sr.pca)$sdev^2
##  [1] 6.966041e+00 4.724590e+00 3.413529e+00 2.141598e+00 1.240864e+00
##  [6] 1.115660e+00 3.227133e-01 3.445467e-02 3.084572e-02 9.703758e-03
## [11] 9.968291e-07 1.236526e-30
# Check Eigenvector values for each PC's
re <- eigen(cor(na.omit(wdata1)))
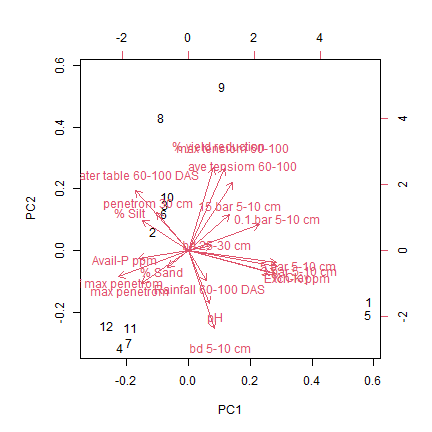
3.3. Principal component analysis for figure 5
Biplot from a principal component analysis of yield reduction by drought a various soil characteristics at the research station drought screening sites characterized in this study. Parameter abbreviations are described in Table 5
# Make a biplot
biplot(sr.pca)